132 private links
Real-Time Streaming Anomaly Detection in Dynamic Graphs.
Karate Club is an unsupervised machine learning extension library for NetworkX.
Karate Club consists of state-of-the-art methods to do unsupervised learning on graph structured data. To put it simply it is a Swiss Army knife for small-scale graph mining research. First, it provides network embedding techniques at the node and graph level. Second, it includes a variety of overlapping and non-overlapping commmunity detection methods. Implemented methods cover a wide range of network science (NetSci, Complenet), data mining (ICDM, CIKM, KDD), artificial intelligence (AAAI, IJCAI) and machine learning (NeurIPS, ICML, ICLR) conferences, workshops, and pieces from prominent journals.
Kroki provides a unified API with support for BlockDiag (BlockDiag, SeqDiag, ActDiag, NwDiag), C4 (with PlantUML), Ditaa, Erd, GraphViz, Mermaid, Nomnoml, PlantUML, SvgBob and UMLet... and more to come!
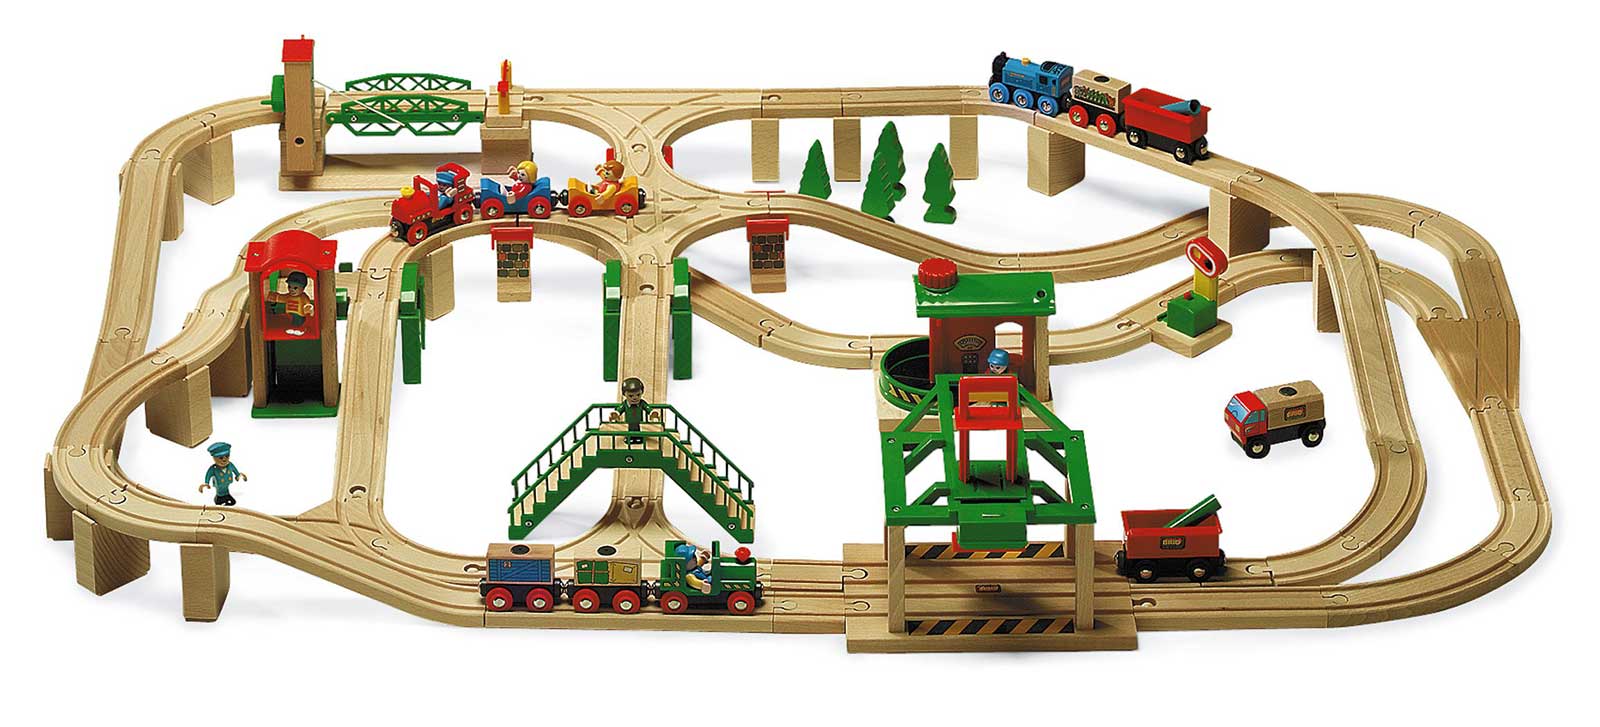
You’ve probably played with model trains, for instance with something like the Brio set shown below.1 And if you’ve built a layout with a model train set, you may well have wondered: is it possible for my train to use all the parts of my track?

Data visualization & Monitoring with support for Graphite, InfluxDB, Prometheus, Elasticsearch and many more databases
Resource for the implementation of the automatic configuration and communication protocol for the Lumentile project.
Animator5D - Very simple-to-use framework for rendering 5-dimensional animations (x, y, z, time, some color value) as an animated gif. This requires ImageMagick to combine the frames, but you can still render them without having it installed and just combine them with some online gif maker.
D3 is a JavaScript library for visualizing data with HTML, SVG, and CSS.
Data visualization is the mechanism of taking tabular or spatial data and conveying it in a human-friendly and visual way. In this article we look at eight open source tools that can help you to create useful and informative graphs.
Highcharts - Interactive JavaScript charts for your web pages.
Graphviz is open source graph visualization software. Graph visualization is a way of representing structural information as diagrams of abstract graphs and networks. It has important applications in networking, bioinformatics, software engineering, database and web design, machine learning, and in visual interfaces for other technical domains.
Graph drawing can be thought of as a form of data visualization, but unlike most other types of visualization the information to be visualized is purely combinatorial, consisting of edges connecting a set of vertices.
