133 private links
Python program that reports memory usage; it can report the "proportional set size" (PSS), a meaningful representation of the amount of memory used by libraries and applications in a virtual memory system; it has built-in chart generation.
Sysdig captures system calls and events from the Linux kernel. You can save, filter, and analyze the data with our CLI or our desktop app. Think of sysdig as strace + tcpdump + htop + iftop + lsof + wireshark for your entire system.
A top-like utility to monitor the sources of power consumption; allows to turn on/off many components; quite useful to track possible power-related issues.
ngrep applies the grep logic to the network layer, allowing to match regular expressions against data payloads of packets; it recognizes IPv4/6, TCP, UDP, ICMPv4/6, IGMP and Raw across Ethernet, PPP, SLIP, FDDI, Token Ring and null interfaces.
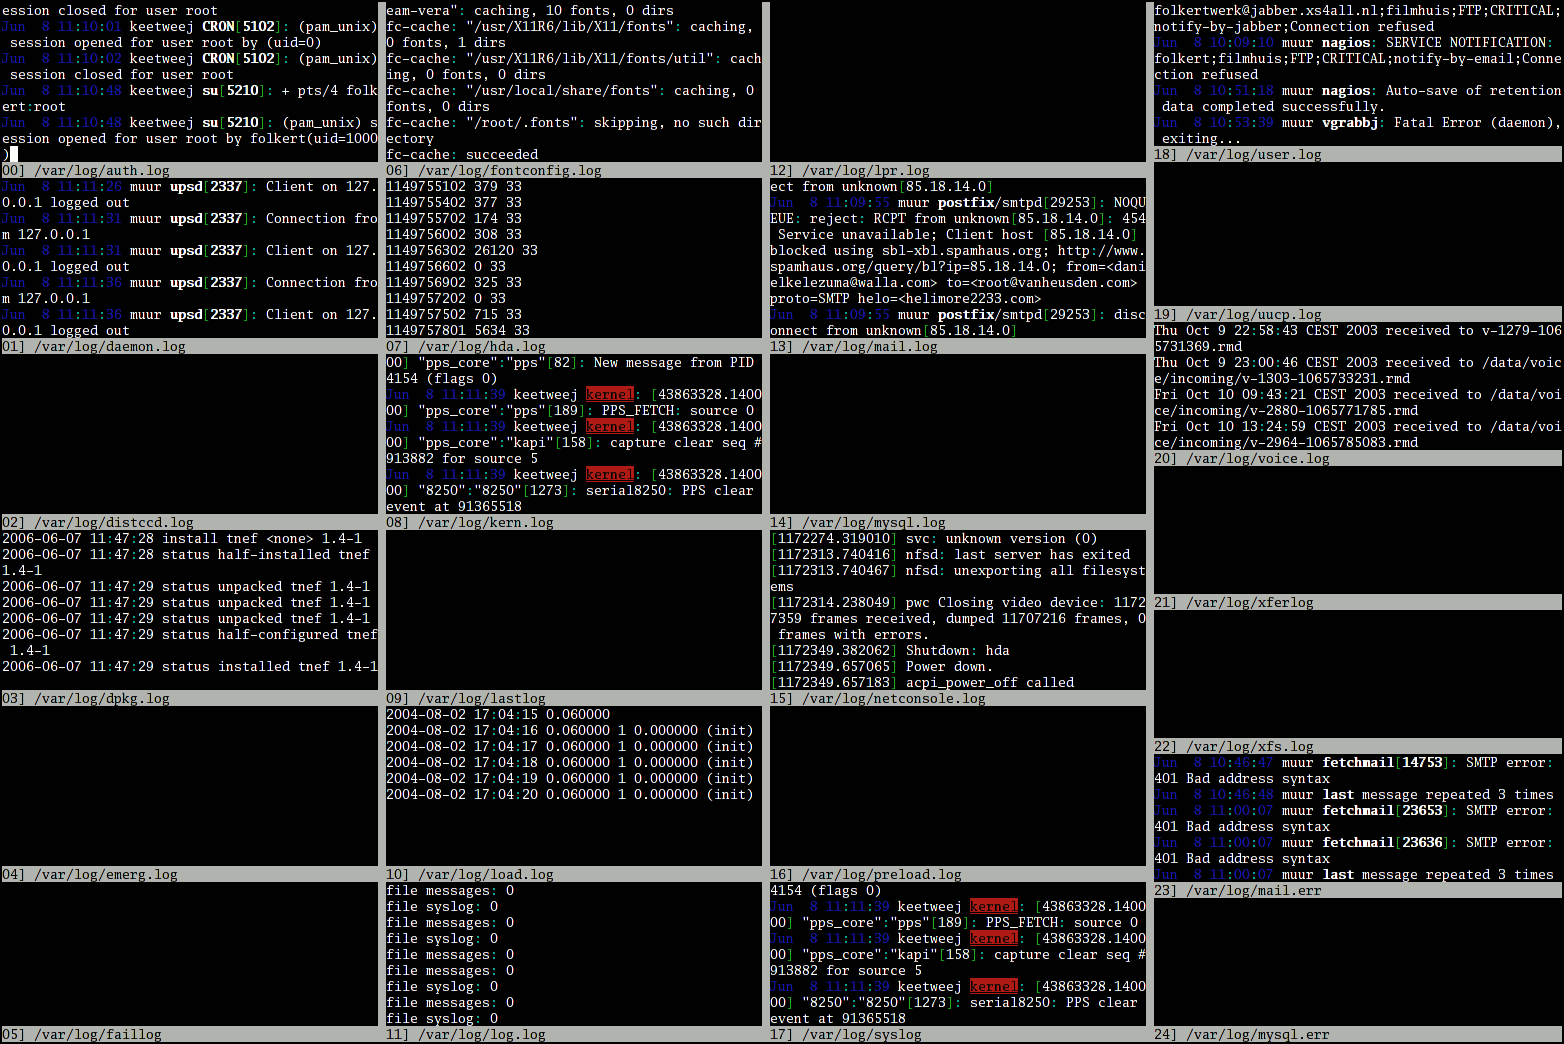
A command to open multiple log files in a single terminal window and monitor them in real-time.

An interactive process viewer for Unix; improves the UI of top, by adding real-time meters and colors.
"A Python program with a top like UI used to show of behalf of which process is the I/O going on".

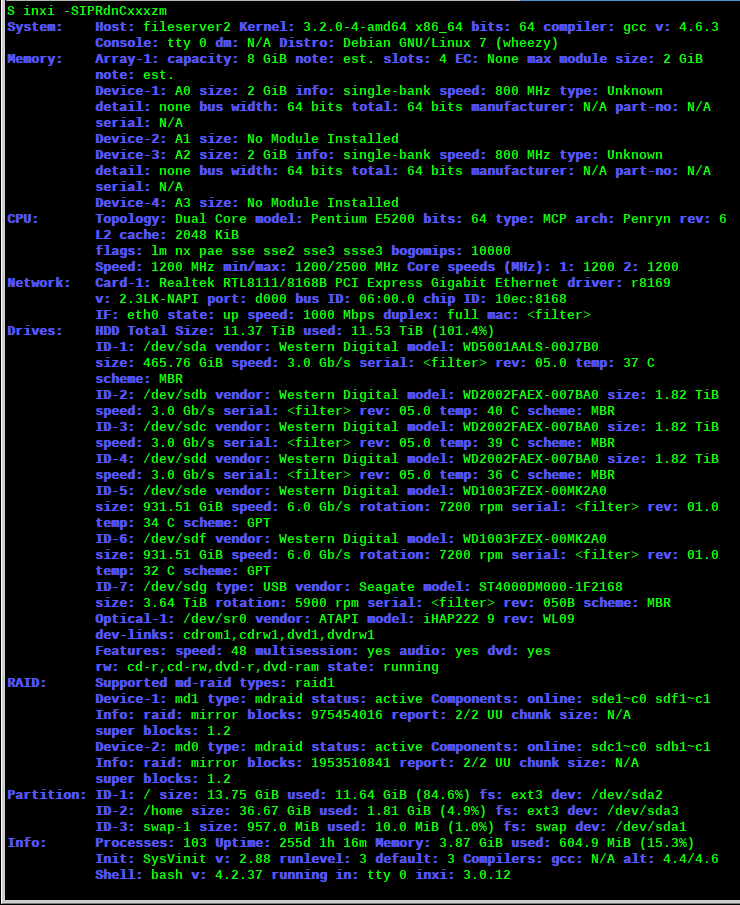
A comprehensive system information script; provides information about CPU, graphics, audio and network devices, drives and partitions, sensors; implemented as a Bash script.

A program to turn CLI tools into web applications; basically, it runs a command and starts a server so that the output can be displayed in a web page.
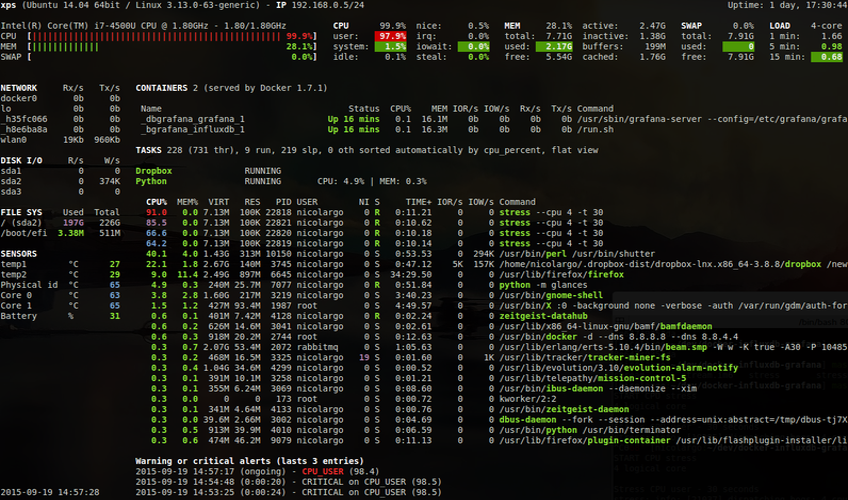
A comprehensive and detailed system monitoring tool; monitored parameters include: CPU, memory, load, process list, network interfaces, disk I/O, sensors, filesystems, docker, system info, uptime.

"looks for coreutils basic commands (cp, mv, dd, tar, gzip/gunzip, cat, etc.) currently running on your system and displays the percentage of copied data. It can also show estimated time and throughput".
ttyload is a lightweight utility which is intended to offer a color-coded graph of load averages over time on Linux and other Unix-like systems. It enables a graphical tracking of system load average in a terminal (“tty“).
A small tool to provide detailed information on the hardware configuration of the machine. It can report exact memory configuration, firmware version, mainboard configuration, CPU version and speed, cache configuration, bus speed, etc.
Neofetch is a CLI system information tool written in BASH. Neofetch displays information about your system next to an image, your OS logo, or any ASCII file of your choice.
rtop is a simple, agent-less, remote server monitoring tool that works over plain SSH. Written in golang, it does not need any software to be installed on the server that you want to monitor. It works by establishing an SSH session, and running commands on the remote server to collect system metrics
High-performance Linux log viewer and analyzer.
SolarWinds® Loggly® makes Linux log monitoring and analysis simple with a powerful platform that can correlate all your logs for a unified view of your environment. It offers cloud-based log aggregation with an agentless approach for collecting logs.
You can use simple scripts to configure your Linux files and directories to send logs to Loggly. Alternatively, you can also use the syslog daemon to send Linux system logs to Loggly for file and application log monitoring. A major advantage of Loggly is that it has a highly intuitive interface with simpler workflows. Unlike other tools, you don’t have to spend countless hours in the initial setup. Loggly automatically archives your older logs on AWS S3 buckets for compliance.
usbrip (inherited from "USB Ripper", not "USB R.I.P.") is an open source forensics tool with CLI interface that lets you keep track of USB device artifacts (i.e., USB event history) on Linux machines.
usbrip is a small piece of software written in pure Python 3 (using some external modules, see Dependencies/pip) which analyzes Linux log data (journalctl output or /var/log/syslog* and /var/log/messages* files, depending on the distro) for constructing USB event history tables. Such tables may contain the following columns: "Connected" (date & time), "Host", "VID" (vendor ID), "PID" (product ID), "Product", "Manufacturer", "Serial Number", "Port" and "Disconnected" (date & time).
For the past few years, I've been building and operating a large distributed system: the payments system at Uber. I've learned a lot about distributed architecture concepts during this time and seen first-hand how high-load and high-availability systems are challenging not just to build, but to operate as well.
Working on the command line is a quick alternative to clicking through filesystem management tasks. Here are some basics to get you started.
The timeout script is a useful resource monitoring program for limiting time and memory consumption of processes in Linux. It allows you to run programs under control, and enforce time and memory limits, terminating the program upon violation of these parameters.
