132 private links
A text editor similar to vim written in Python; many feature are nicely replicated, some are still missing; however, the advantage of this implementation is its simplicity, maintainability and extensibility, thanks to the Python implementation.
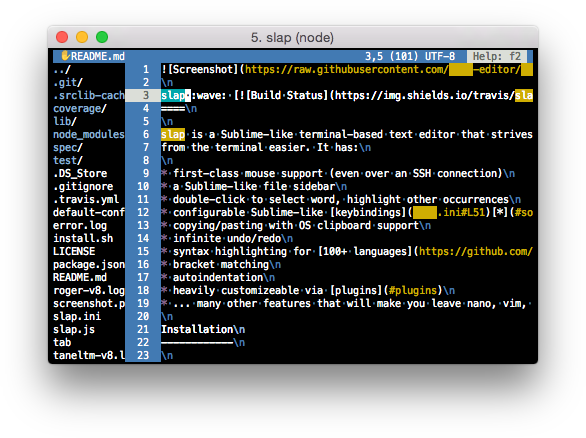
Text editor inspired by Sublime Text written in NodeJS; extendable in Javascript.

A work in progress attempt to improve vim, dropping older/unused OS compatibility, improving the codebase readability, modularity and maintainability; it has chances to become the next choice of vim users.
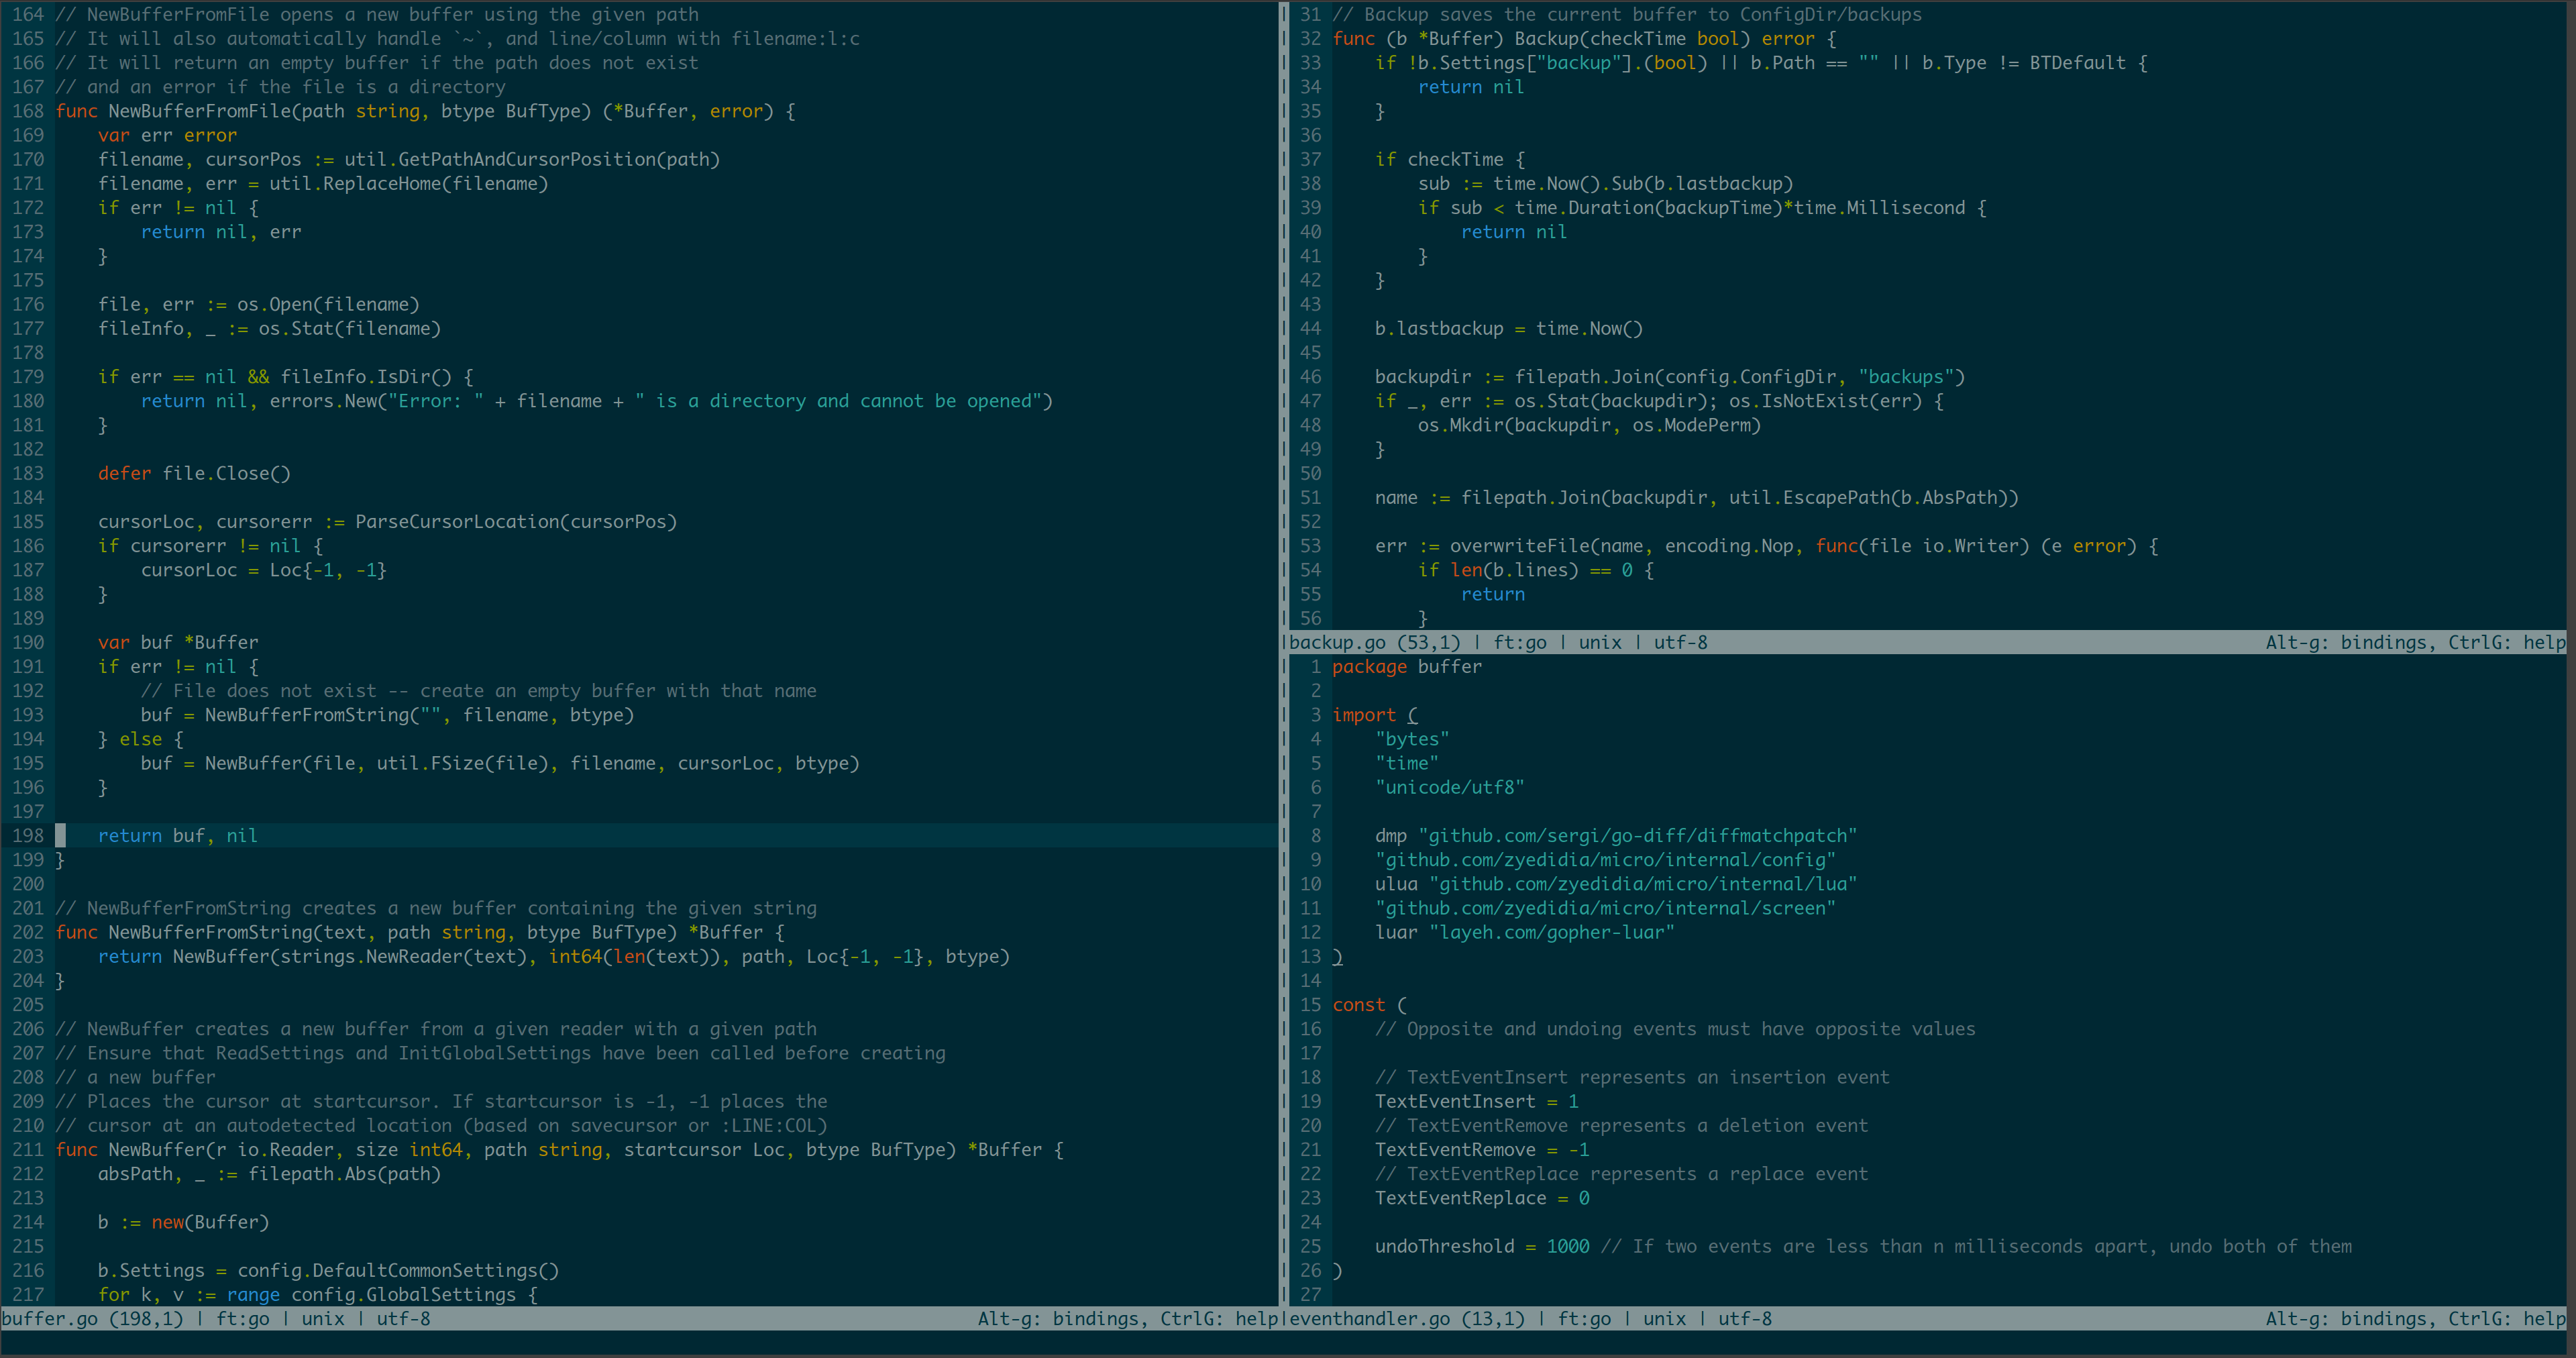
A terminal-based text editor written in Go that aims to be easy to use and intuitive, while also taking advantage of the full capabilities of modern terminals.

Easy to use, lightweight text editor; no complex keybindings to remember.
(Joe's Own Editor) is a compact text editor written in C; a detailed list of features and missing ones is explicitly reported in the website; this editor is mentioned in several web sources for its capability in handling large files.
A text editor with a drop-down menu facility that make it especially user-friendly.
One of the godfathers of text editors; free long-standing software project; tons of extensions and funcionalities; the biggest drawback (my taste): it needs E-Lisp for being programmed.
Secure and simple terminal sharing.
Terminal multiplexer; born to improve screen; client-server architecture, vi and emacs key-bindings, search in window feature and many more.
A fork of tmux that allows to share the terminal with other users. AFAIK, it connects to a centralized server to establish the connection. Someone may see this inconvenient for privacy issues.
Terminal multiplexer that split a physical terminal between several processes, typically interactive shells.
A text-based window manager and terminal multiplexer; it features enhanced profiles, convenient keybindings, configuration utilities, and toggle-able system status notifications; compatible with screen and tmux.
Periodically runs a command in the console while temporarily clearing the screen content; it makes it easy to check differences between the output of two subsequent commands; it provides "diff" functionality to highlight the changing characters between outputs.
The classical Unix utility that provides a rolling display of top cpu using processes.
Python program that reports memory usage; it can report the "proportional set size" (PSS), a meaningful representation of the amount of memory used by libraries and applications in a virtual memory system; it has built-in chart generation.
Sysdig captures system calls and events from the Linux kernel. You can save, filter, and analyze the data with our CLI or our desktop app. Think of sysdig as strace + tcpdump + htop + iftop + lsof + wireshark for your entire system.
A top-like utility to monitor the sources of power consumption; allows to turn on/off many components; quite useful to track possible power-related issues.
ngrep applies the grep logic to the network layer, allowing to match regular expressions against data payloads of packets; it recognizes IPv4/6, TCP, UDP, ICMPv4/6, IGMP and Raw across Ethernet, PPP, SLIP, FDDI, Token Ring and null interfaces.
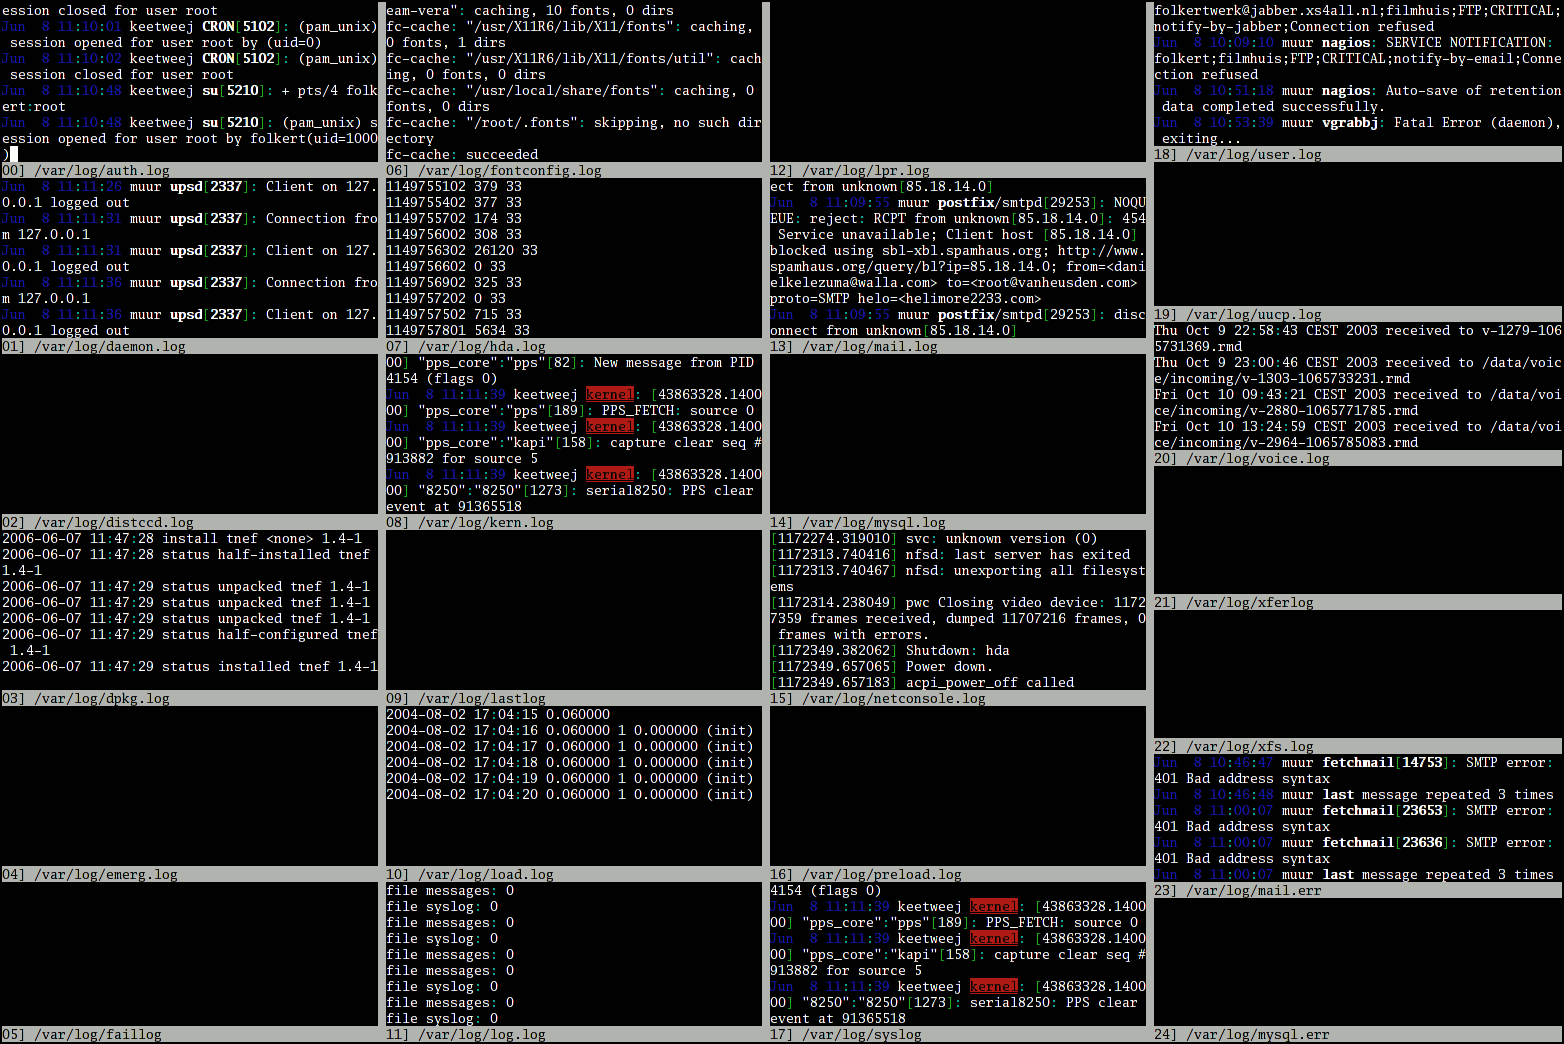
A command to open multiple log files in a single terminal window and monitor them in real-time.

