133 private links
Top command is good but there are better alternatives to Top. Take a look at these system monitoring tools that are similar to top but are actually better.
Haven is for people who need a way to protect their personal areas and possessions without compromising their privacy. It is an Android application that leverages on-device sensors to provide monitoring and protection of physical areas. Haven turns any Android phone into a motion, sound, vibration and light detector, watching for unexpected guests and unwanted intruders. We designed Haven for investigative journalists, human rights defenders and people at risk of forced disappearance to create a new kind of herd immunity. By combining the array of sensors found in any smartphone, with the world's most secure communications technologies, like Signal and Tor, Haven prevents the worst kind of people from silencing citizens without getting caught in the act.
In this tutorial, we are going to discuss about some good alternatives to Top command line task manager program.
Periodically runs a command in the console while temporarily clearing the screen content; it makes it easy to check differences between the output of two subsequent commands; it provides "diff" functionality to highlight the changing characters between outputs.
The classical Unix utility that provides a rolling display of top cpu using processes.
Python program that reports memory usage; it can report the "proportional set size" (PSS), a meaningful representation of the amount of memory used by libraries and applications in a virtual memory system; it has built-in chart generation.
Sysdig captures system calls and events from the Linux kernel. You can save, filter, and analyze the data with our CLI or our desktop app. Think of sysdig as strace + tcpdump + htop + iftop + lsof + wireshark for your entire system.
A top-like utility to monitor the sources of power consumption; allows to turn on/off many components; quite useful to track possible power-related issues.
ngrep applies the grep logic to the network layer, allowing to match regular expressions against data payloads of packets; it recognizes IPv4/6, TCP, UDP, ICMPv4/6, IGMP and Raw across Ethernet, PPP, SLIP, FDDI, Token Ring and null interfaces.
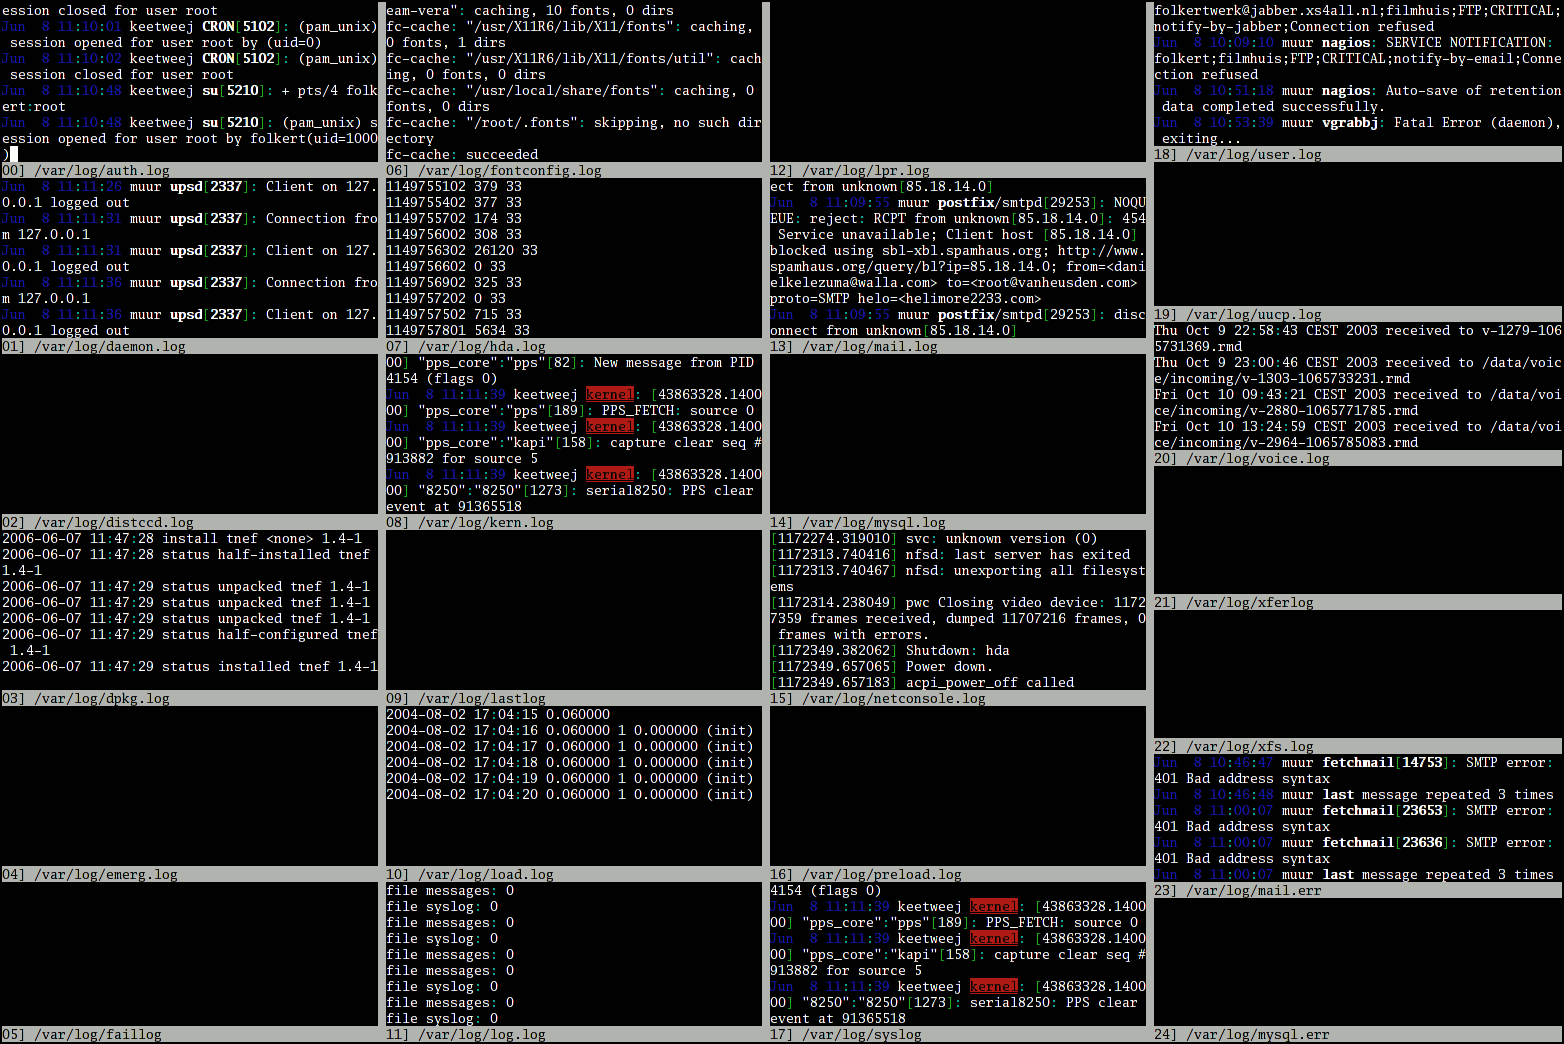
A command to open multiple log files in a single terminal window and monitor them in real-time.

An interactive process viewer for Unix; improves the UI of top, by adding real-time meters and colors.
"A Python program with a top like UI used to show of behalf of which process is the I/O going on".

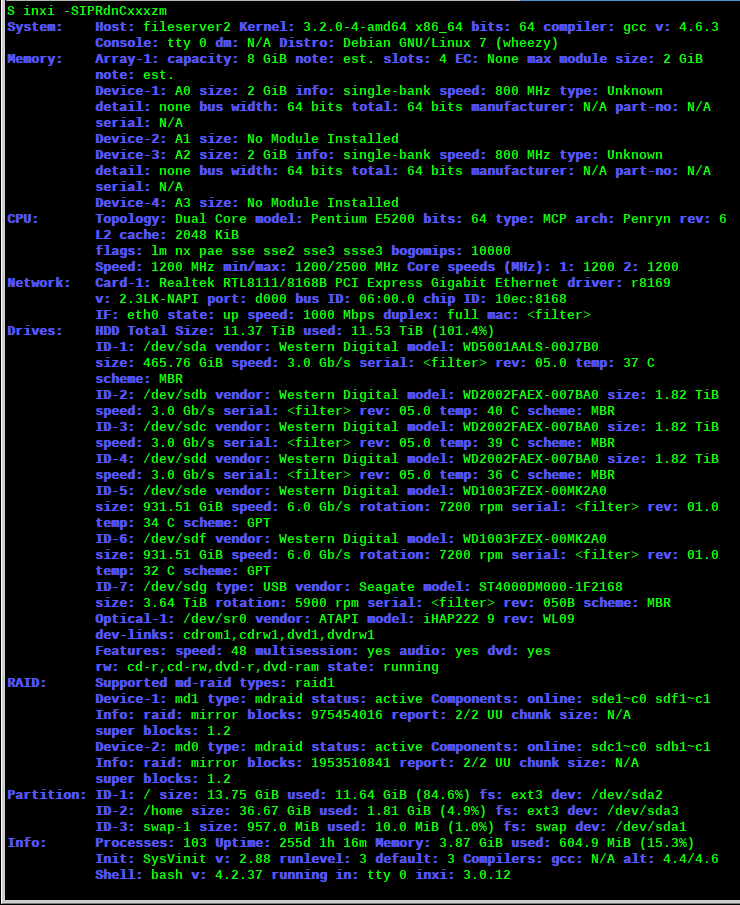
A comprehensive system information script; provides information about CPU, graphics, audio and network devices, drives and partitions, sensors; implemented as a Bash script.

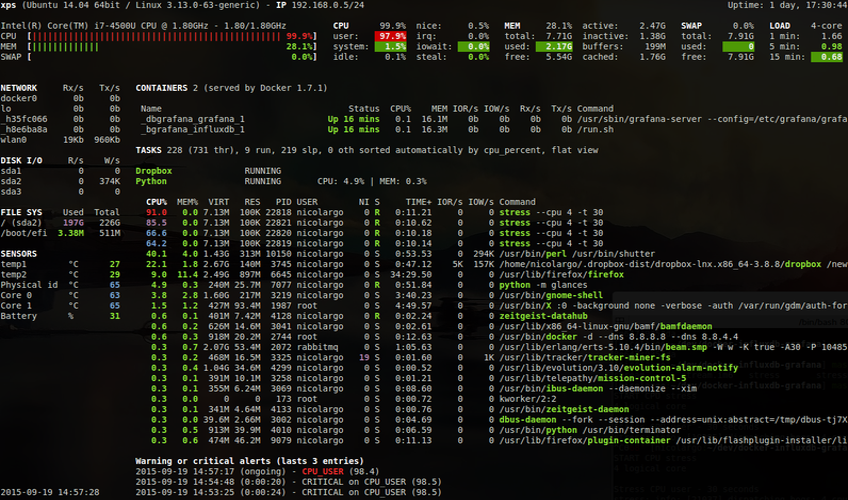
A comprehensive and detailed system monitoring tool; monitored parameters include: CPU, memory, load, process list, network interfaces, disk I/O, sensors, filesystems, docker, system info, uptime.

"looks for coreutils basic commands (cp, mv, dd, tar, gzip/gunzip, cat, etc.) currently running on your system and displays the percentage of copied data. It can also show estimated time and throughput".
ttyload is a lightweight utility which is intended to offer a color-coded graph of load averages over time on Linux and other Unix-like systems. It enables a graphical tracking of system load average in a terminal (“tty“).
A small tool to provide detailed information on the hardware configuration of the machine. It can report exact memory configuration, firmware version, mainboard configuration, CPU version and speed, cache configuration, bus speed, etc.
Neofetch is a CLI system information tool written in BASH. Neofetch displays information about your system next to an image, your OS logo, or any ASCII file of your choice.
rtop is a simple, agent-less, remote server monitoring tool that works over plain SSH. Written in golang, it does not need any software to be installed on the server that you want to monitor. It works by establishing an SSH session, and running commands on the remote server to collect system metrics
