131 private links

VisiData is an interactive multitool for tabular data. It combines the clarity of a spreadsheet, the efficiency of the terminal, and the power of Python, into a lightweight utility which can handle millions of rows with ease.

OpenRefine (previously Google Refine) is a powerful tool for working with messy data: cleaning it; transforming it from one format into another; and extending it with web services and external data.
OpenRefine always keeps your data private on your own computer until YOU want to share or collaborate. Your private data never leaves your computer unless you want it to. (It works by running a small server on your computer and you use your web browser to interact with it)
Real-Time Streaming Anomaly Detection in Dynamic Graphs.
PandaPy has the speed of NumPy and the usability of Pandas (10x to 50x faster).
Your laptop is way more powerful than you think. Unleash its full potential with the Vaex dataframe library.
This recent Tweet erupted a discussion about how logistic regression in Scikit-learn uses L2 penalization with a lambda of 1 as default options. If you don’t care about data science, this sou…
PCA is a linear dimensionality reduction technique. Many non-linear dimensionality reduction techniques exist, but linear methods are more mature, if more limited.
Natural language processing algorithms applied to three million materials science abstracts uncover relationships between words, material compositions and properties, and predict potential new thermoelectric materials.
The overwhelming majority of scientific knowledge is published as text, which is difficult to analyse by either traditional statistical analysis or modern machine learning methods. By contrast, the main source of machine-interpretable data for the materials research community has come from structured property databases, which encompass only a small fraction of the knowledge present in the research literature. Beyond property values, publications contain valuable knowledge regarding the connections and relationships between data items as interpreted by the authors. To improve the identification and use of this knowledge, several studies have focused on the retrieval of information from scientific literature using supervised natural language processing, which requires large hand-labelled datasets for training. Here we show that materials science knowledge present in the published literature can be efficiently encoded as information-dense word embeddings (vector representations of words) without human labelling or supervision. Without any explicit insertion of chemical knowledge, these embeddings capture complex materials science concepts such as the underlying structure of the periodic table and structure–property relationships in materials. Furthermore, we demonstrate that an unsupervised method can recommend materials for functional applications several years before their discovery. This suggests that latent knowledge regarding future discoveries is to a large extent embedded in past publications. Our findings highlight the possibility of extracting knowledge and relationships from the massive body of scientific literature in a collective manner, and point towards a generalized approach to the mining of scientific literature.
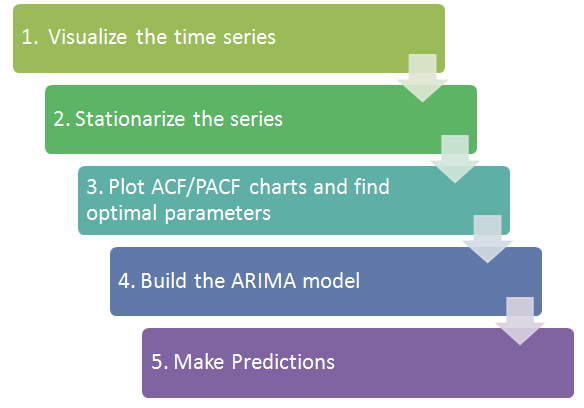
This web site contains notes and materials for an advanced elective course on statistical forecasting that is taught at the Fuqua School of Business, Duke University. It covers linear regression and time series forecasting models as well as general principles of thoughtful data analysis.
The time series material is illustrated with output produced by Statgraphics, a statistical software package that is highly interactive and has good features for testing and comparing models, including a parallel-model forecasting procedure that I designed many years ago.
The material on multivariate data analysis and linear regression is illustrated with output produced by RegressIt, a free Excel add-in which I also designed. However, these notes are platform-independent. Any statistical software package ought to provide the analytical capabilities needed for the various topics covered here.
A receiver operating characteristic (ROC) is a graph that illustrates the performance of a binary classifier as its discrimination threshold (cutoff) is changed.
The curve is created by plotting the true positive rate (TPR) against the false positive rate (FPR) at various cutoff settings. The true-positive rate is known as sensitivity, the false-positive rate is known as the fall-out and is calculated as (1 - specificity).
The ROC curve is thus a plot of the true positives (TPR) versus the false positives (FPR). The ROC curve can be generated by plotting the cumulative distribution function (area under the probability distribution from - ∞ to + ∞ ) of the correct detection probability in the y-axis versus the cumulative distribution function of the false-alarm probability in x-axis.